

1952 Topps Baseball Cards - Perspectives Part 1
1952 Topps Baseball Cards - Perspectives Part 1

Introduction
The 1952 Topps baseball card set is by far my favorite in the hobby. I like the 1961 and 1972 Topps sets as well, but 1952 is the prettiest belle at the ball. So, I started the (near) impossible journey of accumulating examples of each card to complete this set. Sadly, over the past 10 years or so, prices have gone up so high that there is really no way I’ll ever complete it. But I despair not, as I had an idea to contribute to the lore of this set.
You see, I’m a data analyst by trade and have read every article I can get my hands on regarding the 1952 set. From print run theories to various multi-printed cards, I decided to look into the hard data. Of course, Topps never published their production numbers, nor the layout of the cards on the uncut sheets. We do have examples of these sheets in photos, which are found later in this research paper.
An article written by George Vrechek (https://oldbaseball.com/refs/5253printing.html) gives a wonderful discourse on this subject. The author postulates about single, double, triple and even quadruple prints of certain cards relative to each other. His ideas are well thought-out and almost had me sold.
We know for certain that there were six series of cards released. Some series had their quirks, most notably the color of the backs (Series one had red and black, Series three had cream and gray). Of course, there were the error cards of Sain and Page, Campos and House, but those cards are exceptions and not discussed in this paper.
A massive assumption that I’ve seen is that Topps printed the 52s on sheets of 10x10. Further down in this research paper are examples of uncut sheets out there in the wild that provide great insights into how these cards were produced. For instance, below is an advertisement for Woolworths that, to me, is iconic. It’s difficult to see what actual cards are on the uncut panels, but I have broken it down for you, dear reader.
Initial Volley into Uncut Sheets
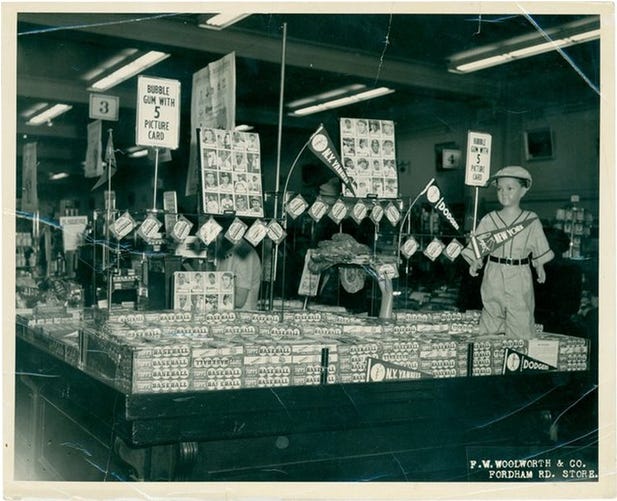
I began this research with a single picture, just above, which doesn’t have the resolution necessary to read the names on the cards. Luckily, I have a modest collection of these cards and could identify them by holding cards up to the screen.
The Woolworth’s photo shows three uncut panels, all of which are from Series 1. Below is the layout by card number.
Bottom Left Panel
Top row: 53, 54, 55, 56
Bottom row: 63, 64, 65, 66
Center
Top row: 51, 52, 53, 54
Second row: 61, 62, 63, 64
Third row: 71, 72, 73, 74
Bottom row: 31, 32, 33, 34
Right
Top row: 55, 56, 57, 58
Second row: 65, 66, 67, 68
Third row: 75, 76, 77, 78
Bottom row: 35, 36, 37, 38
While a great piece of history this Woolworth’s picture doesn’t provide us with any more detail than we already know from other Series 1 panels. Would that we could travel back in time…
Graded Card Population and Distribution
Now let the analysis begin! This week I downloaded the population report from PSA and SGC for the entire 1952 set. At first glance, it was difficult to find any signal or indication of scarcities. My first task was to see which cards had the highest population amongst graded cards. The top 10 graded cards:

After compiling this list, I thought it would be fun to see which cards have the lowest graded populations. Seems to me these cards would be worth pursuing!

Graded Card Population
Next comes a breakdown of how many in each series have been graded. Note the first three rows of this table are all of the same Series 1… row three is a sum of rows 1 & 2.

* The average graded population over the entire set is 813 per card (Series 1 and 3 combined).
The color variations in Series 1 (55/45) favor red over black.
The color variations in Series 3 (95/5) favor cream over gray.
Because the series don’t have the same number of cards, I calculated the average number of graded examples for each card. Some observations:
Series 1 is by far the most graded when red & black backs are combined (1018 average per card).
Series 2 was likely printed in slightly less quantity than Series 1, but this time Topps didn't vary the card stock. Only 50 cards in this series.
Series 3 was likely printed in far less quantities, sporting a new cream back card stock, but some gray stocks snuck through production (95% cream, 5% gray in graded populations). There is no reason to doubt this was also roughly the same proportion that was printed. I posit that the gray backs were first, probably leftover card stock from Series 2.
Series 4 picked up the pace with some bright young stars, such as Minoso, Bauer, Ashburn, Garagiola, Doby and Kell. This series was likely released around mid-season and did not sport any crazy variations.
Series 5 was printed in more limited quantities compared to the other series and captured the exciting rookie, Willie Mays.
Series 6... well, what to say here? Based on population reports, these cards are definitely NOT the most scarce of the set, with no member breaking the top 10 least graded (figure 2). By the numbers it appears that despite the infamous harbor dump, these cards are as plentiful as Series 5 cards. While this series legitimately commands the title of "high series" cards, it appears to this author that there is no real scarcity that warrants their current market value.
Series 5 Single Print Theory
Now to address the single print theory. Specifically, in series 5 cards 281-300 show a population average of 85% of the series average of 683. By the numbers:

Even though 289, 295, 296 aren't labeled as SP's, it's clear that they should be considered as such.
In my view, the phrase “single print” is a bit misleading; it’s just a “short” print, averaging about 85% of the other cards in the series. Single (short) print theory – CONFIRMED.
Ungraded Cards in the Wild
It's anybody's guess how many raw 1952s are on the loose, gracing collections, albums, boxes and scrap books. Personally, I have about 200 ungraded. I don't believe there is a significantly sized raw card pool to move the market, let alone affect the overall proportions of the graded population. In other words, what we see now in population reports is likely not to change significantly. If we take Willie Mays and Mickey Mantle as a maximum for population purposes, it seems likely that the analysis above (focused on series population totals and proportions) would not change significantly relative to each other.
Some current amounts of raw cards available to collectors (non-Ebay):
The Battersbox : 3820 raw
Dean's Cards: 432 raw
Greg Morris Cards: 468
GFG Cards: 1500 raw
Total: 6220 raw cards readily available on the open market… maybe add 1000 from Ebay and you can see there aren’t very many remaining, let alone pristine examples that still need to be graded.
Uncut Card Sheet Analysis
Now, to do some analysis on the layout of the various photos of sheets available!
Series 1: Luckily, we have many panels to inspect. I’d like to point out some aspects about this series first.
1. Note the borders – it looks likely that this was, indeed, a complete panel judging on the thickness of the white card stock. Could it be that the panels were only 5 cards wide? Down below you’ll see various lengths and widths, so it’s difficult to determine one size that fits all.
2. If it was a stand-alone panel, there ought to be a corresponding “right side” panel with the numbers in parentheses in the table. I was not able to find an example.
3. The three pictures that follow are consistent with the Woolworth’s picture (Image 1).

Next, we have the panels for card numbers 41-80! In this case, we have both “left” and “right” sides woot! It appears that cards 51-60 were likely double printed… at least for either red or black backs.
Time to check the populations to see if the numbers bear this out. Let’s see… that answer is surprisingly, no! It turns out that the overall populations are consistent with the rest of the series (except for Robin Roberts, but he’s a star and thus an outlier).
It appears that the uncut sheets had a generous border for the machine to manipulate and cut. I can imagine that 70 years ago alignment of these sheets in the cutters would have been quite difficult (as well as keeping the blades sharp!)

Looking at the bottom of this panel, the cut makes it appear that it has been separated from a lower half. But looking carefully at the bottom right, it looks to me like this was indeed a complete panel, and the cutting on the left bottom edge was either done by hand or a machine miscut. A miscut could potentially explain why this sheet even exists, perhaps being pulled off the production line as scrap and squirreled away by a worker as a trophy! Never know.

As we don’t have the pictures of the reverse (back sides of the cards), we can only assume that the layouts were identical.
So now we come to an unexpected picture of another panel (again, a 5x5). Katy bar the door! Look at this! Gil Hodges leads this charge by his presence on the lower row. Also, we have double prints on the Preacher Roe row! Well now, it appears there were multiple layouts for the series 1 panels. How confusing! (Perhaps this was a variation with the black/red colored backs… just spit balling like Gaylord Perry.)

Continued in Part 2!